Quantify the social and business value of your volunteerism (including traditional, skills-based, pro bono, and board service) and benchmark the results to prove and improve the value of your program.
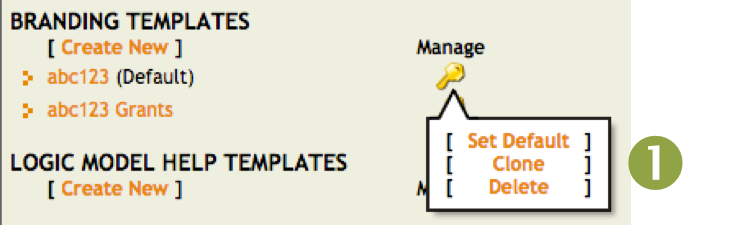
1. Edit Branding Template
Step 1: Clone a branding template:
Under the Admin Tab under Branding Templates
Click the Manage key icon
Click Clone
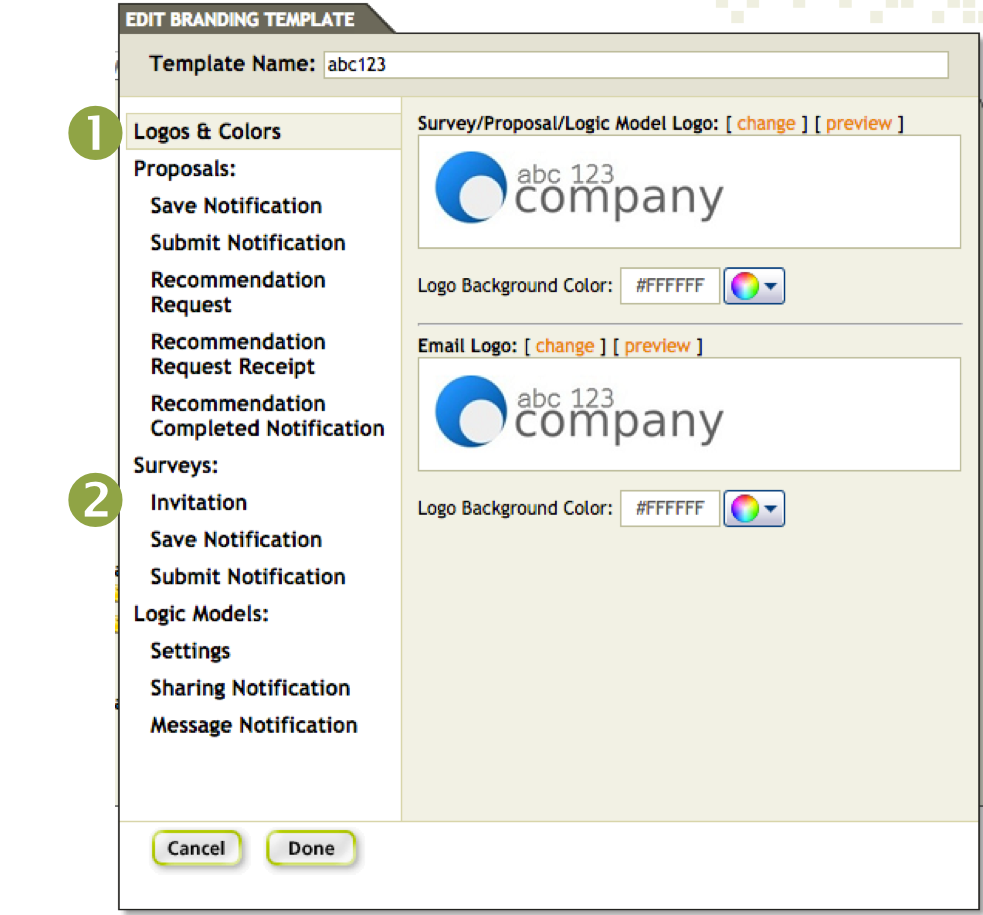
Step 2: Formatting and Uploading Logos:
Keep the existing logo or add event logo
Edit logos centered on a white background with a height of 70 pixels (the width will vary by logo
2. Customize Survey Invitations
Step 3: Customize Survey Invitations and Notifications:
Within Edit Branding Template, click through to the Survey.
Sender Name: [Company Name] Volunteers (or, the branded name of the company’s program)
Email Subject: “Please take 5 min - Impact Survey”
Email Body Text: Open Editor
Body Text. For editing the body of the customized email, use the source code view with break tags (i.e., <br /> to ensure consistent formatting. At the bottom of the email, include the name of the contact person, their title, email, and phone number. Customize the Email Sender Name, for the Save and Submit Notifications.
Note: If the survey is in anonymous mode, the save survey function is not available, so the notification is not relevant.
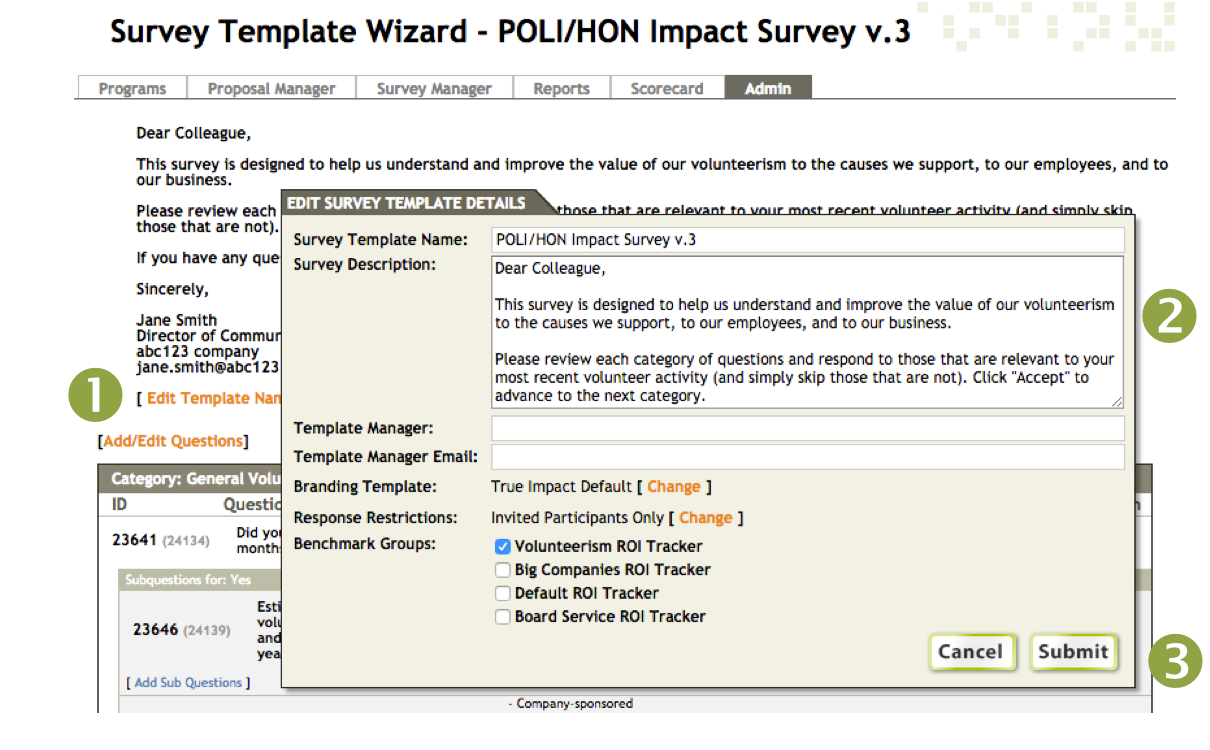
3. Customize Survey Introduction
Step 4: Customize the Survey Template
Under the Admin tab, click Create/Edit Templates to edit the Survey.
Click on the POLI/HON Impact Survey v.3 Survey Template
Click on [ Edit Template Name, Introductory Text, and Branding ] under survey introduction customize the introduction text and signature.
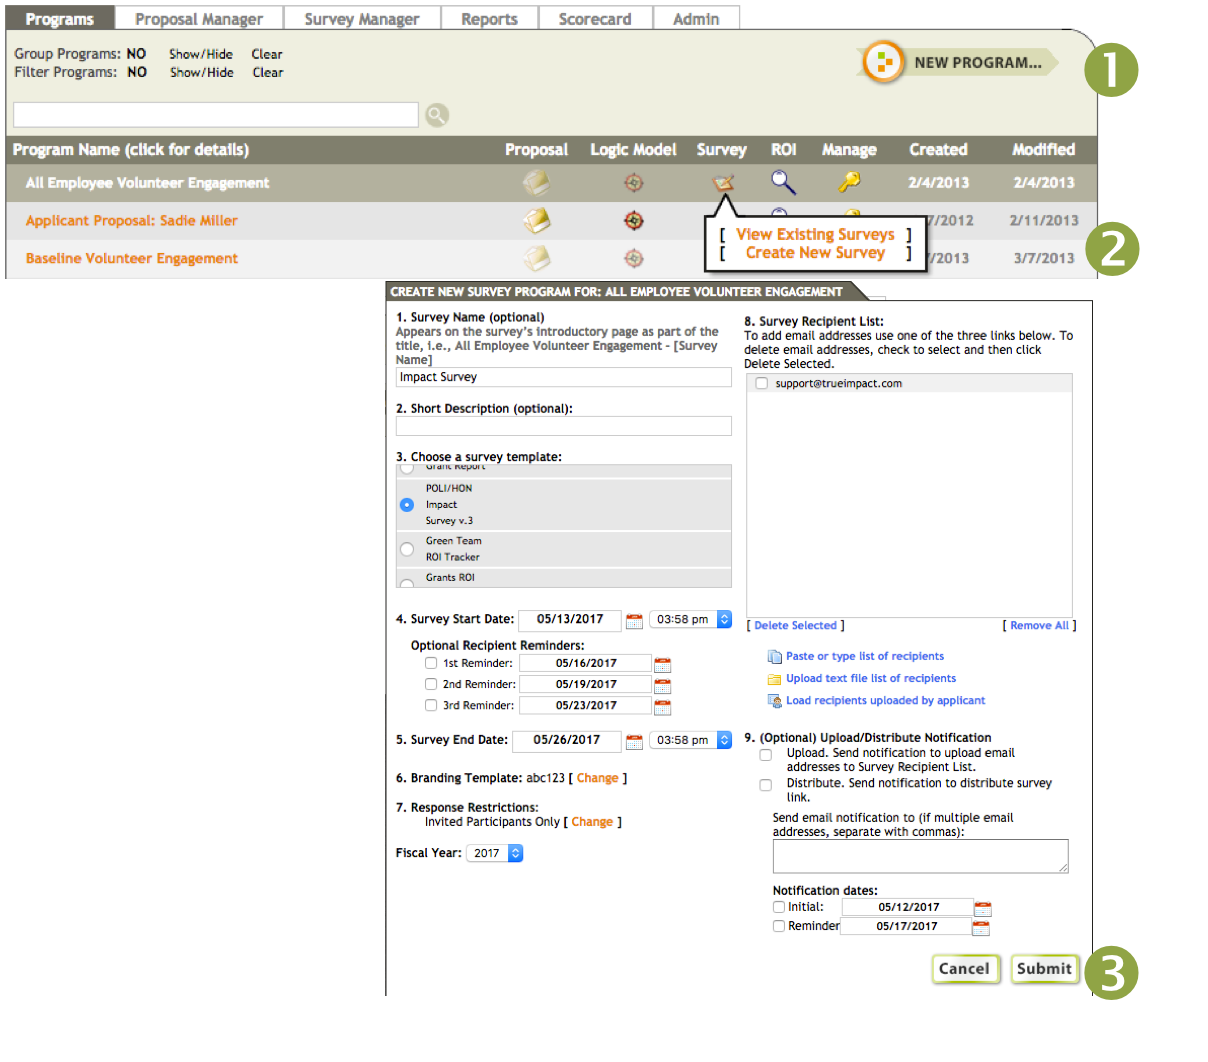
4. Create Program and Survey
Step 1: Create program and link to survey template
In the Programs tab, click New Program, enter “Volunteer Activity” as the program name, and then click Create.
After the program appears under Program Name, hover over the survey icon to the right, and click Create New Survey to launch the Survey Creation window.
Step 2: Create Survey
Survey Name: Impact Survey
Choose a survey template: the template shows up (because we made it public)
Survey Start Date: select today to test a survey
Branding Template: Select the branded template
Email Participants: Use this to test what the survey looks like. Click “paste or type list of recipients” and add your own email address.
Set Response Restrictions
Click submit
Step 3: Launch Survey
Click on the survey Program Name under Survey Manager
Click Add Recipients Upload emails with one on each line (separated by a paragraph break)
Submission status will change to cued (if the survey is open) or Waiting to Start (if the survey is set in the future)
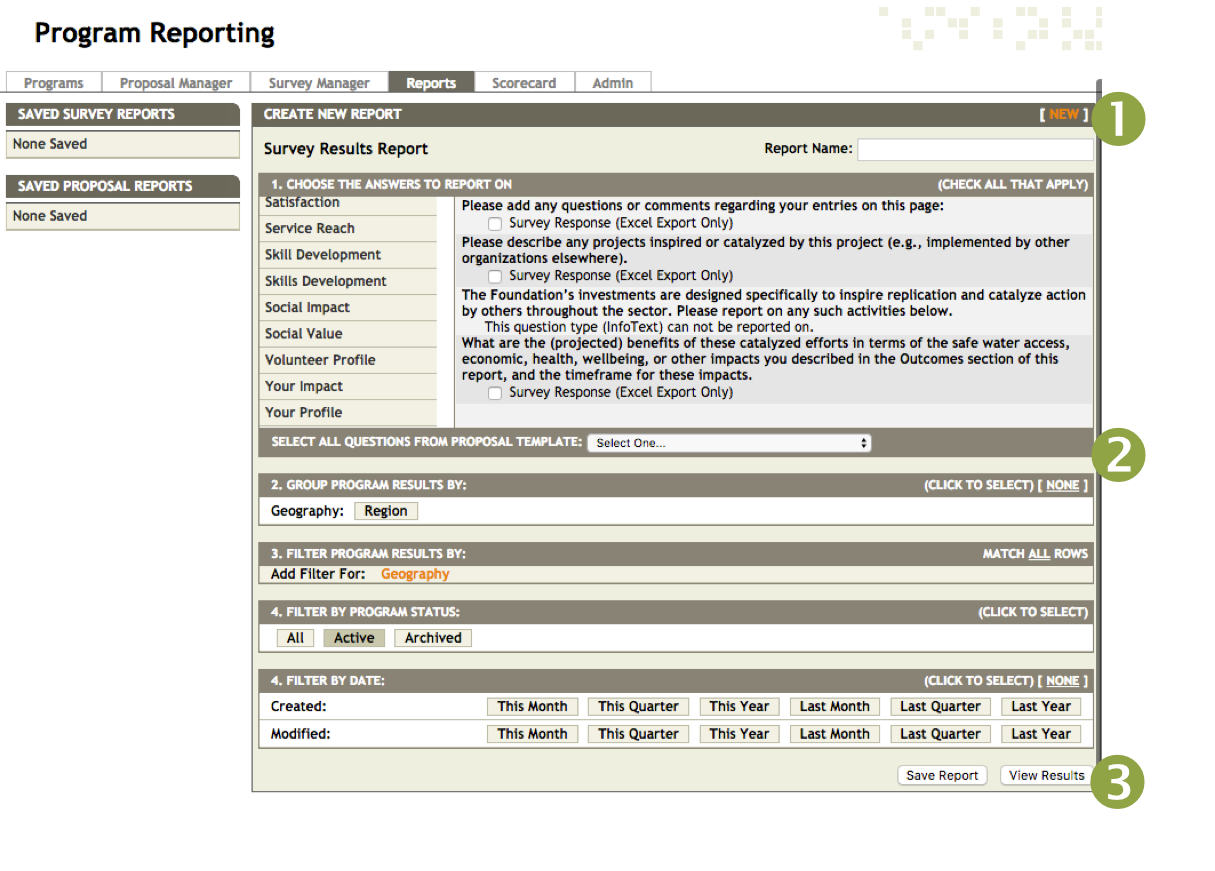
5. Export Results
Volunteerism ROI Tracker Benchmarking
Analysis for Volunteer Tracker survey Click on the Benchmarking tab to access results Available for companies participating in benchmarking
Summary Survey Data
Summary results for individual survey, with pie charts and percentages
Access summary information for individual surveys via the Summary button in the Survey Manager tab
Copy and paste results from Summary Results box, or export Excel file of result
Full survey export
Full report of individual respondent responses to each survey question
Access full survey export through the Report tab
Exported Excel file can be used to sort survey responses and perform in-depth analysis
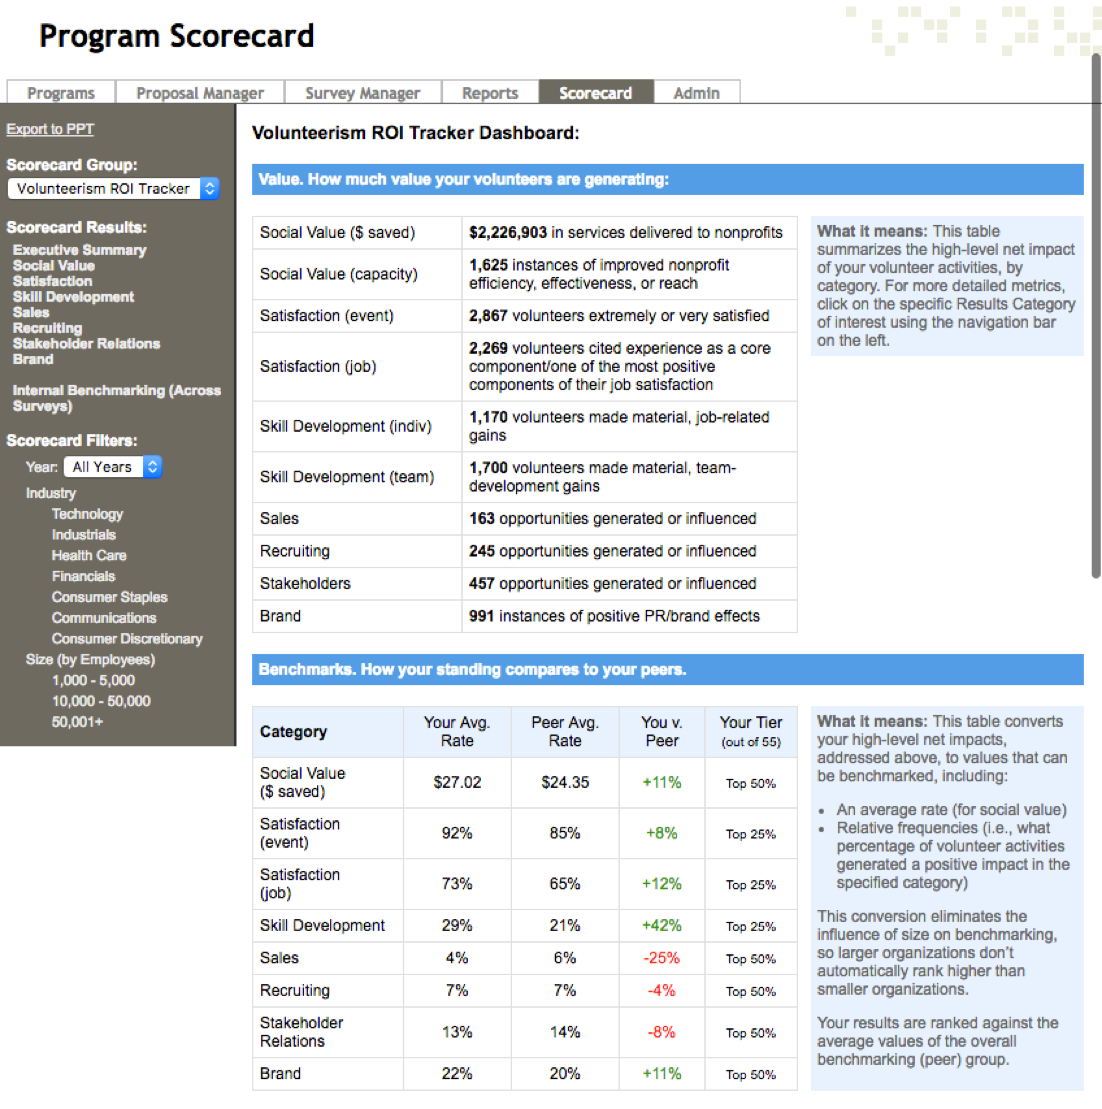
5. Review Scorecard Results
Summary
Results are organized into the impact categories that you see in the left sidebar, which you can click into to reveal more detailed analysis.
The executive summary includes a high-level description of your volunteer activities, by category.
Below are overall rankings compared to the benchmark average for each category. The red indicates where your performance falls below the benchmark average, and green indicates when you are above the average.
Impacts (Money Saved):
The first impact category in Social Value uses the Bureau of Labor Statistics occupational data to monetize the services provided by your volunteers. Below is benchmarking data and a graph comparing companies by their social value rank.
Impacts (Nonprofit capacity):
The next category in Social Value disaggregates the reported capacity gains of volunteers by activity. So this percent of volunteers improved an organization’s efficiency or effectiveness (which is their ability to serve more people at the same cost, or their success rate). The table below illustrates what percent of volunteers increased the organization’s reach, by activity. So, across activities, this percent of volunteers helped increase the reach of beneficiary organizations.
Value Drivers:
Each category includes your ranking within the benchmark group, and a graph of impacts by volunteer activity.
The Value Drivers graph provides information on what type of volunteerism makes the most impact by that category, so you can increase the value of your projects based on what is most important to you.
The value drivers table in Social Value compares the hourly rates of each volunteer activity. For companies committed to increasing the monetary value of their service initiatives, it makes sense to prioritize the educational and skills-based activities in the green. The other value driver graphs will give you more insight on what activities have high satisfaction, skills, and business impacts.
Verbatims:
Social Value verbatims highlight how volunteers increased capacity, efficiency, and effectiveness, and also provide a list of volunteer projects. By clicking on the question, reveal respondents individual answers.